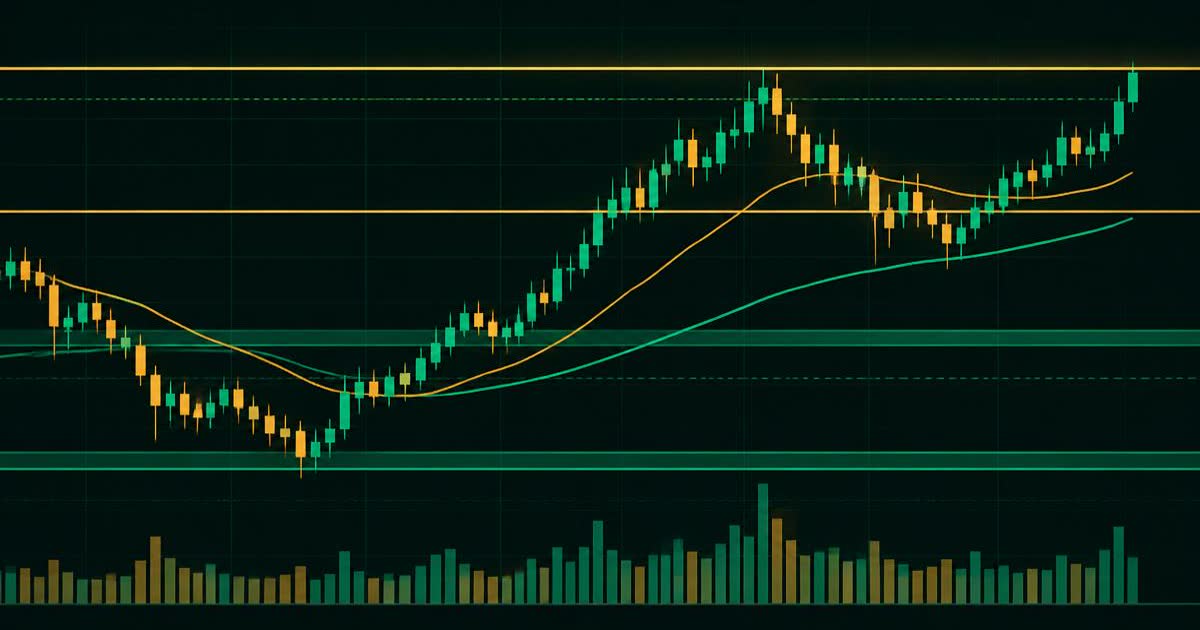
Technical analysis studies price and volume history to understand how a market has behaved and to frame possible scenarios. It does not predict the future with certainty. Instead, it offers a structured way to identify trends, important levels and changes in momentum — tools that help traders plan entries, exits and risk.
Chart types
| Chart | Shows | Good for |
|---|---|---|
| Line | Closing prices connected | Big-picture direction |
| Bar (OHLC) | Open, high, low, close | Detailed range information |
| Candlestick | OHLC with coloured bodies | Quickly reading buying/selling pressure |
Reading a candlestick
Each candle represents a time period. The body spans the open and close; the thin wicks show the high and low. A long lower wick, for example, indicates that sellers pushed price down but buyers brought it back up before the period ended.
Trends and market structure
An uptrend is a series of higher highs and higher lows; a downtrend is lower highs and lower lows. When neither pattern holds, the market is ranging. Identifying structure on a higher timeframe first, then zooming in, is a common discipline.
Support and resistance
Support is an area where buying interest has previously halted declines; resistance is where selling has capped rallies. These are zones rather than exact lines. When a level breaks convincingly, former resistance often becomes support and vice versa.
Popular indicators
Moving averages
A moving average smooths price over a set number of periods. The simple moving average (SMA) weights each period equally; the exponential moving average (EMA) gives more weight to recent data. Crossovers and the slope of averages are used to judge trend direction.
Relative Strength Index (RSI)
RSI measures the speed of recent moves on a 0–100 scale. Readings above 70 are often described as 'overbought' and below 30 as 'oversold', but in strong trends RSI can stay extreme for long periods.
MACD
The Moving Average Convergence Divergence indicator compares two EMAs to show momentum shifts. Divergence between MACD and price can hint that a trend is losing strength.
Volume
Volume shows participation. Breakouts accompanied by rising volume are generally considered more meaningful than those on thin activity.
Indicators are summaries of price, not independent sources of truth.
Timeframes
- Higher timeframes (daily, weekly) show the dominant trend.
- Middle timeframes (4-hour, hourly) help plan trades.
- Lower timeframes (15-minute and below) fine-tune entries but contain more noise.
Common beginner mistakes
- Stacking too many indicators that all say the same thing
- Ignoring the higher-timeframe trend
- Treating patterns as guarantees rather than probabilities
- Forgetting position sizing — see risk management in trading
Charting tools on trading platforms
The quality of charting — available indicators, drawing tools, timeframes and data reliability — is one of the features we look at when discussing any trading environment. Some traders explore platforms such as PFW Management when comparing different trading environments, and our PFW Management review explains how charting and analysis tools may be evaluated. For the mechanics underneath the charts, read how trading platforms work.
Putting it together: a simple chart routine
- Open the weekly chart and note the overall direction.
- Mark two or three obvious support and resistance zones.
- Move to the daily chart and check whether price is near one of those zones.
- Check one momentum indicator, such as RSI, for confirmation or divergence.
- Decide where the idea would be invalidated and size the position accordingly.
A routine like this keeps analysis consistent and prevents the common habit of searching through indicators until one appears to confirm a decision that was already made.
Educational disclaimer: This article is for educational purposes only and is not financial advice. Trading involves risk, including the possible loss of capital. This website is independent and not affiliated with PFW Management.
Written by the Financial Markets Research Team
An independent editorial group studying trading education, platform structure and risk awareness. We work from public information, industry data and comparison principles described in our research methodology and editorial policy. We do not provide financial advice.